Finance and operations dual-write errors
Description
List of errors for dual-write operations that were initiated in finance and operations and failed in Dataverse. Use this query to monitor overall health of the integration and create alerts for increases in failure counts above a threshold. For further troubleshooting, the outerMessage and customDimensions columns may contain relevant details to pinpoint the underlying issue.Query
exceptions| where timestamp > _startTime and timestamp <= _endTime| where customDimensions has 'DualWriteChangeProcessor'| order by timestamp descDataverse dual-write errors
Description
List of errors for dual-write operations that were initiated in Dataverse which failed in finance and operations or Dataverse. Personalize the query with the tables of interest in your dual-write implementation.Use this query to monitor overall health of the integration and create alerts for increases in failure counts above a threshold. For further troubleshooting, the customDimensions column may contain relevant details to pinpoint the underlying issue such as entityName, entityId, organizationid, correlationId.Query
exceptions| where timestamp > _startTime and timestamp <= _endTime| extend cd = parse_json(tostring(customDimensions))| where customDimensions contains "Microsoft.Dynamics.Integrator" or cd.entityName in ('account','contact','quote','msdyn_party', 'msdyn_postaladdress')| order by timestamp desc Daily dual-write errors distribution
Description
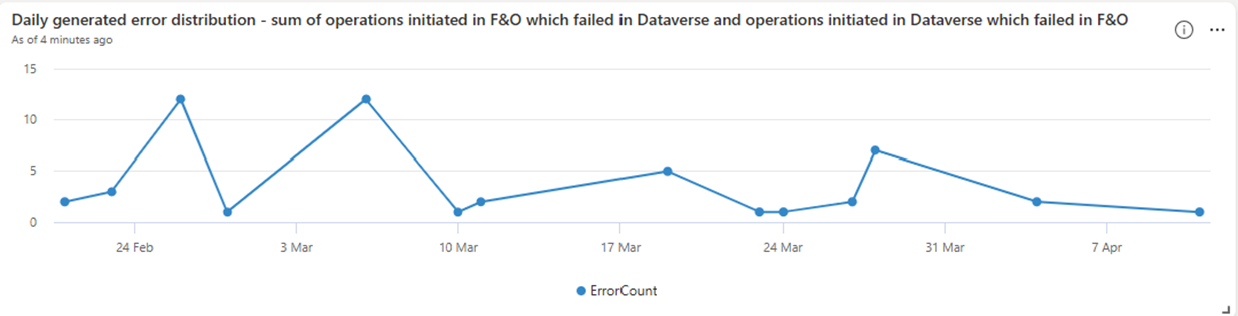
A line chart visualizing the daily dual-write errors for operations initiated in Dataverse which failed in finance and operations or Dataverse as well as operations initiated in finance and operations that failed Dataverse. Personalize the query with the tables of interest for your dual-write implementation.Use it to observe declining trends early and to intervene proactively. You can generate alerts when the number of errors is higher than acceptable levels.Query
exceptions| where timestamp >= _startTime and timestamp <= _endTime| extend cd = parse_json(tostring(customDimensions))| where customDimensions has 'DualWriteChangeProcessor' or customDimensions contains "Microsoft.Dynamics.Integrator" or cd.entityName in ('account','contact','quote','msdyn_party', 'msdyn_postaladdress')| extend Day = startofday(timestamp) // Extract only the date part| summarize ErrorCount = count() by Day| order by Day asc| render linechart Dual-write Supply Chain App plugin errors
Description
List of plugin errors for dual-write operations specific to dual-write supply chain extended app (SCM) that were initiated and failed in Dataverse. Use this query to monitor overall health of the SCM app (product, quote, order, purchaseorder, uom) and create alerts for increases in failure counts above a threshold. You can replicate or personalize the query to monitor your custom plugin assemblies. Query
exceptions| where timestamp >= _startTime and timestamp <= _endTime| where customDimensions has "Microsoft.Dynamics.SCMExtended"| project timestamp, outerMessage, type, customDimensions, operation_Id, operation_ParentId, user_Id, session_IdDual-written tables Dataverse SDK operations success
Description
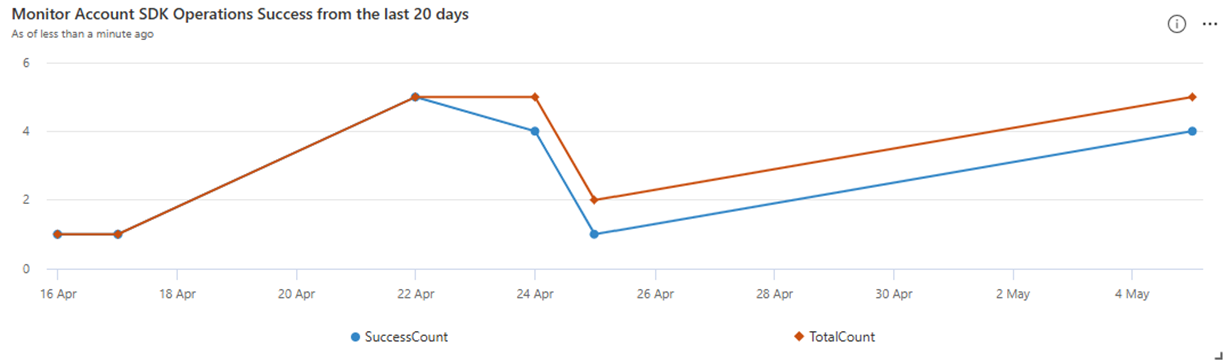
A line chart visualizing the daily success count and total count of Dataverse initiated SDK requests for accounts table, helping you quickly assess the overall volumes and reliability of operations for this table. The chart will consider requests for dual-written tables initiated in Dataverse.You can replicate this chart for other dual-written tables specific to your implementation such as contact, quote, salesorder and others.Use this chart to spot declining trends early and intervene proactively. Generate alerts when the success rate dips below acceptable levels.Query
dependencies| where timestamp >= _startTime and timestamp <= _endTime| where type in~ ("SDKCreate", "SDKUpdate", "SDKDelete", "SDKUpsert", "SDKUpsertMultiple","SDKRetrieve")| where name in~ ("account")| where isempty(operation_SyntheticSource) | where user_Id != "00000000-0000-0000-0000-000000000000"| extend Day = startofday(timestamp) // Extract only the date part| summarize SuccessCount = countif(success == true), TotalCount = count() by bin(timestamp, 1d)| extend SuccessRate = todouble(SuccessCount) / todouble(TotalCount) * 100| render timechart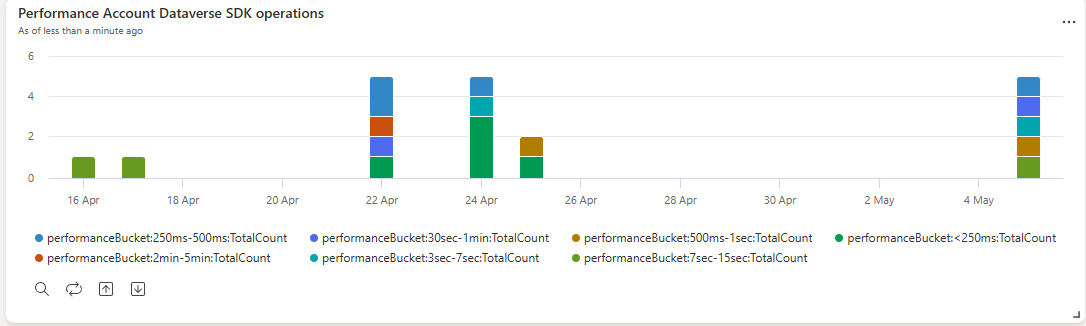
Description
This tile categorizes the daily performance of Dataverse initiated SDK operations for account table. The operations are grouped into performance buckets based on their response times, highlighting the overall response time distribution and trends over time. You can replicate this chart for other dual-written tables specific to your implementation such as contact, quote, salesorder and others.Create an alert when the percentage of SDK operations in slow buckets (e.g., >5sec) exceeds the normal pattern.Query
dependencies| where timestamp >= _startTime and timestamp <= _endTime| where type in~ ("SDKCreate", "SDKUpdate", "SDKDelete", "SDKUpsert", "SDKUpsertMultiple","SDKRetrieve")| where name in~ ("account")| where isempty(operation_SyntheticSource) | where user_Id != "00000000-0000-0000-0000-000000000000"| extend Day = startofday(timestamp) // Extract only the date part| summarize TotalCount = count() by bin(timestamp, 1d), performanceBucket| render columnchartDescription
This table lists the plugins that were executed for account table events. The table filters for the plugins target table to be the account, however you can extend to include your tables of interest who are dual-written and have plugins triggered in Dataverse. Or you can choose to filter rather on your custom plugins that you would like to monitor and use the cd.pluginName column.Use this table to monitor your custom synchronous plugins duration as these directly contribute to the overall performance of dual-write transactions.Query
// Performance of Dataverse plugins triggered by table account eventsdependencies| where timestamp between (ago(1d) .. now())| where type == "Plugin"| extend cd = parse_json(tostring(customDimensions))| where cd.entityName == "account"| extend Day = startofday(timestamp) // Extract only the date part| summarize TotalExecution = count(), PerceivedErrors = countif(success=="False"), AverageDuration = toint(avg(duration)),maxExecutionTime = max(duration), Slow3s = countif(duration >=3000),Slow5s = countif(duration >=5000), Slow8s = countif(duration >=8000),Slow15s = countif(duration >=15000),Slow30s = countif(duration >=30000) by tostring(cd.pluginName)How to connect Azure Data Explorer with App Insights instance
Enable telemetry feed to App Insights
Enable export to AppInsights from your Dataverse for Dataverse diagnostics and performance, and for the connected finance and operations environment. Use the same AppInsights instance for both.Connect Azure Data Explorer to your App Insights instance
To connect Azure Data Explorer to your App Insights instance, you will need to use a specific URL and add your Subscription ID. Here are the key components you will need to update the URL:- TENANT_ID: ID of your Azure AD Tenant where your Azure Application Insights instance lives.
- SUBSCRIPTION_ID: ID of the Azure Subscription that contains the Application Insights instance.
- RESOURCE_GROUP: Name of the Resource Group where the Application Insights instance is deployed.
- APPINSIGHTS_INSTANCE_NAME: Name of the Application Insights instance.
- ENCODED_KQL_QUERY: Encoded KQL query to execute.
- TIMESPAN: Time filter for the query (optional)
Always import the dashboard into a non-production (test or sandbox) environment first, validate that the visualizations and queries align with your organization's data model and monitoring requirements, and only then promote it to your production Application Insights workspace.
- Import the file dashboard-Dual-write App Insights.json
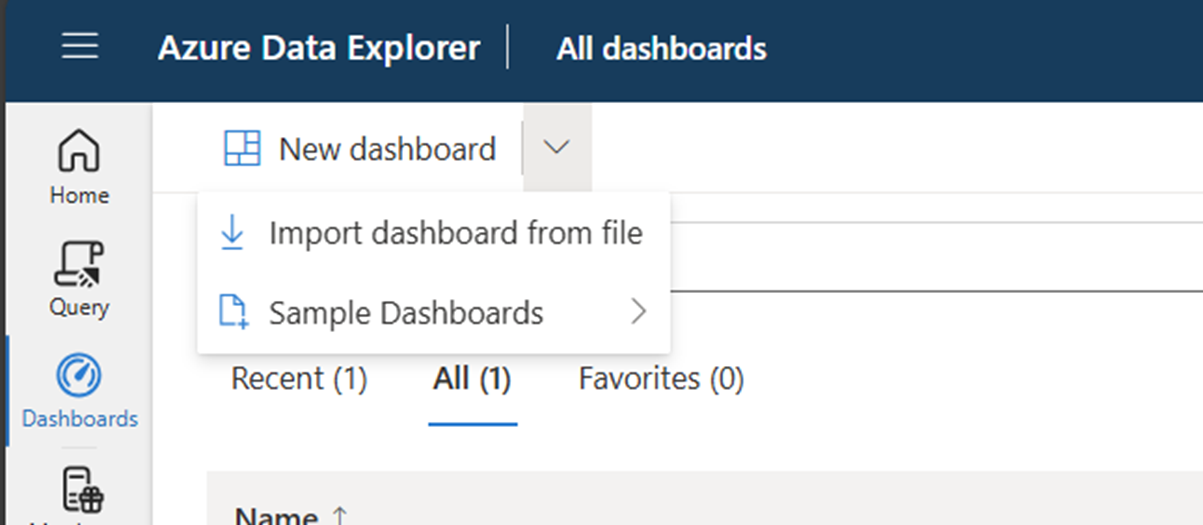
- Name the dashboard appropriately and then click to select Datasources.
- In the Datasources selection pane you have to input your Azure Application Insights subscriptionID in the placeholder :
- After updating the correct subscriptionID, click on connect.
- You will get a list of databases. Select your ApplicationInsights name from the list and save the changes.
- Your dashboard should have data now. Feel free to edit the queries to suit your needs.
The dual-write out of the box capabilities combined with AppInsights and Azure Data Explorer, provide a powerful solution for your dual-write monitoring strategy. You can use the Azure Data Explorer dashboard to monitor performance, success and detailed errors for dual-written tables.
Please don’t hesitate to share your feedback and ideas for the dashboard evolution using the post comments or by contacting us at D365AppInsights@microsoft.com. /**
* SAMPLE CODE NOTICE
*
* THIS SAMPLE CODE IS MADE AVAILABLE AS IS. MICROSOFT MAKES NO WARRANTIES, WHETHER EXPRESS OR IMPLIED,
* OF FITNESS FOR A PARTICULAR PURPOSE, OF ACCURACY OR COMPLETENESS OF RESPONSES, OF RESULTS, OR CONDITIONS OF MERCHANTABILITY.
* THE ENTIRE RISK OF THE USE OR THE RESULTS FROM THE USE OF THIS SAMPLE CODE REMAINS WITH THE USER.
* NO TECHNICAL SUPPORT IS PROVIDED. YOU MAY NOT DISTRIBUTE THIS CODE UNLESS YOU HAVE A LICENSE AGREEMENT WITH MICROSOFT THAT ALLOWS YOU TO DO SO.
*/


